
【This Week’s Results & ChatGPT】 Try to Managing a Free EA Portfolio 2 (8-12 May 2023)

Mini-review – We asked ChatGPT!
ChatGPT is good at writing programs, so I am writing ChatGPT to present a simple MT5 tool to everyone, but a working program has not been completed yet. When an error is pointed out, it will be corrected immediately, but no matter how many times you try, the error will not go away, and even if the error is corrected, it will not work, and the fundamental solution has not been reached.
If it’s a simple program, it would be quicker for me to make it myself.
Well, for me, the way I use ChatGPT now is to get an easy-to-understand summary of trading methods and technical tools. Let’s take a look at the basic indicators again.
Q: Please tell me how to read the Ichimoku Kinko Hyo in Forex.
A: Response by ChatGPT: https://chat.openai.com/auth/login
Ichimoku Kinko Hyo is a versatile technical indicator developed by Goichi Hosoda in the 1960s. It is primarily used to identify trends, support and resistance levels, and potential entry and exit points for trades. Here’s a step-by-step guide on how to read the Ichimoku Kinko Hyo in Forex trading:
- Understand the components: The Ichimoku Kinko Hyo consists of five lines:a) Tenkan-sen (Conversion Line): The average of the highest high and the lowest low over the last 9 periods. b) Kijun-sen (Base Line): The average of the highest high and the lowest low over the last 26 periods. c) Senkou Span A (Leading Span A): The average of the Tenkan-sen and Kijun-sen, projected 26 periods into the future. d) Senkou Span B (Leading Span B): The average of the highest high and the lowest low over the last 52 periods, projected 26 periods into the future. e) Chikou Span (Lagging Span): The current closing price, plotted 26 periods into the past.
- Identify the trend: The area between Senkou Span A and Senkou Span B is called the “Kumo" or cloud. The cloud changes color based on the position of Senkou Span A and B. If Senkou Span A is above Senkou Span B, the cloud is green (bullish). If Senkou Span B is above Senkou Span A, the cloud is red (bearish).a) Bullish trend: Price is above the cloud, and the cloud is green. b) Bearish trend: Price is below the cloud, and the cloud is red. c) Range-bound or consolidation: Price is within the cloud.
- Support and resistance levels: The Kumo (cloud) acts as support and resistance levels. In an uptrend, the cloud acts as support, while in a downtrend, it acts as resistance. The thickness of the cloud also plays a role; the thicker the cloud, the stronger the support or resistance.
- Trade signals:a) Buy signal: When the price moves above the cloud and Tenkan-sen crosses above Kijun-sen, it’s a bullish signal. For a stronger confirmation, the Chikou Span should also be above the cloud. b) Sell signal: When the price moves below the cloud and Tenkan-sen crosses below Kijun-sen, it’s a bearish signal. For a stronger confirmation, the Chikou Span should also be below the cloud.
- Stop-loss and take-profit levels: You can set stop-loss orders below the Kumo in a long position or above the Kumo in a short position. The Kijun-sen can also serve as a trailing stop-loss. For take-profit levels, you can use traditional methods such as Fibonacci retracements or pivot points.
Keep in mind that, like any other technical indicator, Ichimoku Kinko Hyo should be used in conjunction with other tools and analysis methods to increase its effectiveness. Additionally, practicing on a demo account is always helpful before using it with real money.
When I do discretionary trading, I often use the Ichimoku Kinko Hyo clouds and moving averages to determine the trend, but I would appreciate it if you could summarize it as a sentence again.
MQL5 Free EA – NOZAX Portfolio No.2
NOZAX Portfolio NO.2
- Account: NZX Zero (ECN) (NOZAX)
- Initial balance: 100,000 yen
- Working EA:
- TraderMind EA MT5: Currency Pair: USDCAD#, Timeframe: 1 Hour, Lot quantity: 0.04 Lot
- White Bear DT for NOZAX v1.13: Currency pair: USDJPY#, Timeframe: 5-minute, Lot quantity: 0.02 lot

- Gold Multiply Funds EA: Currency Pair: XAUUSD#, Timeframe: 30-minute, Lot quantity: 0.01 lot
- Catastrofix EA MT5: Currency Pair: EURGBP#, EURAUD#, EURNZD#, EURUSD#, GBPCAD#, AUDJPY#, Timeframe: 1 Hour, Lot quantity: 0.01 lot
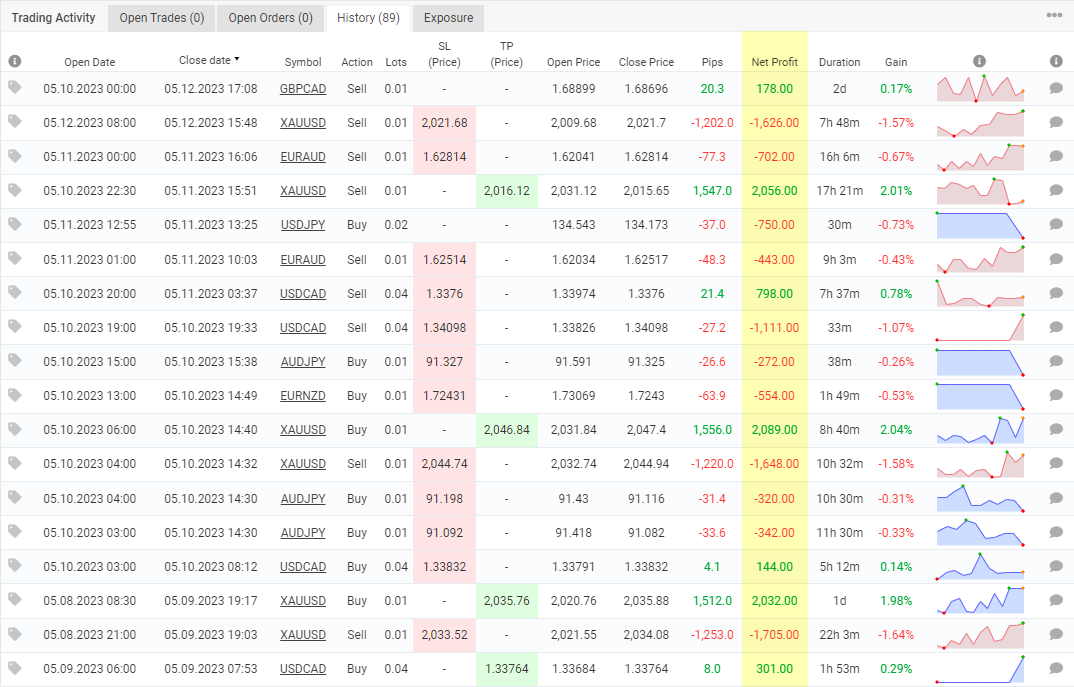
Results from 8 to 12 May (NOZAX Portfolio No.2)
- TraderMind EA MT5: 3 win and 1 loss, total profit and loss was 132 yen (6.3 pips).
- White Bear DT USDJPY: 0 wins and 1 losse, total profit and loss was -750 yen (-37.0 pips).
- Gold Multiply Funds EA: 3 win and 3 losses, total profit and loss was 1198 yen (940 pips).
- Catastrofix EA MT5: 1 wins and 6 losses, total profit and loss was -2455 yen (-260.8 pips).
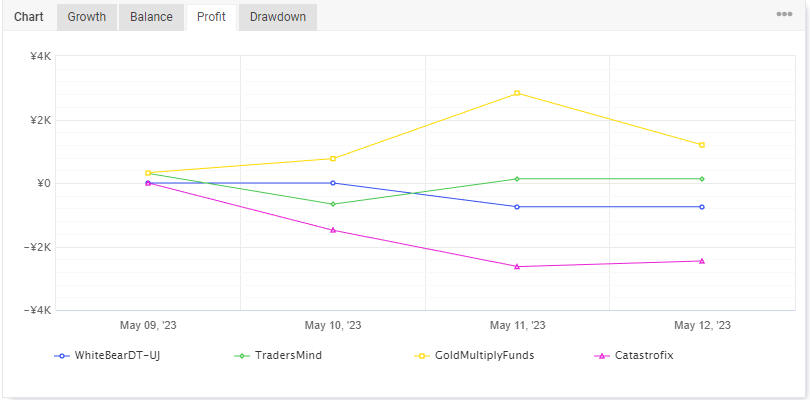
- Gold Multiply Funds EA was the best performer this week.
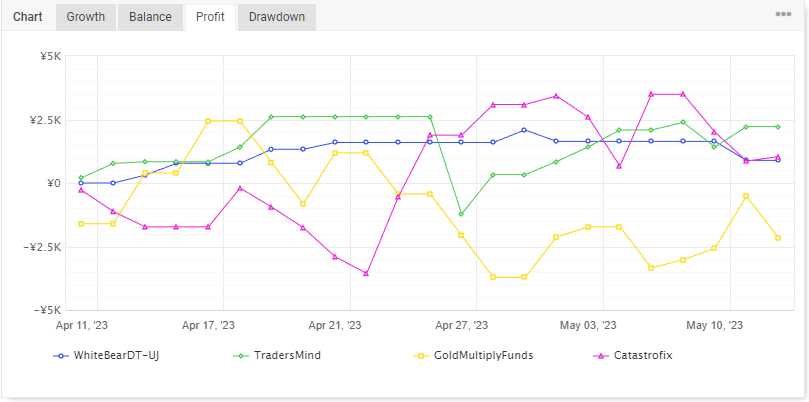
Past Results(NOZAX Portfolio No.2)
The individual results of each EA in the portfolio No. 2 are as follows.
- 10 April-12 May 2023
(Trades with a profit of even 1 yen are counted as “winning", while the reverse is counted as “negative")
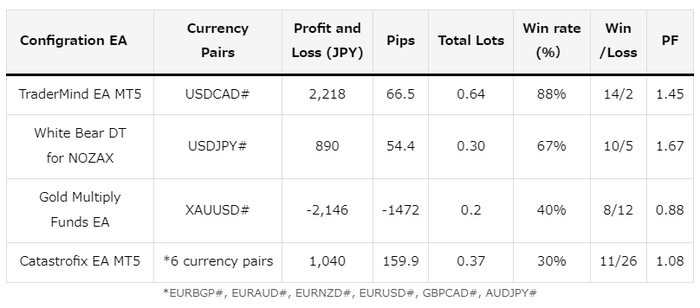

- Balance: 100,000 yen → 102,002 yen
Current status and schedule of the portfolio
The Gold Multiply Funds are still in negative territory, but managed to end the week in positive territory. I would like to take a closer look. It’s on thin ice.
Let’s hope the overall portfolio picks up from next week onwards.
NOZAX
Up-and-coming MT5 FX broker [NOZAX] → → → Click here for details!